2024 will be the first year above 1.5°C
Posted on 11 November 2024 by Zeke Hausfather
This is a re-post from The Climate Brink, and an excerpt from a much more detailed State of the Climate Q3 2024 report that I published over at Carbon Brief today. See that for more details on climate model/observation comparisons, sea ice extent, and other climate variables.
In my latest quarterly state of the climate assessment over at Carbon Brief, I analysed records from five different research groups that report global surface temperature records: NASA’s GISTEMP; NOAA’s GlobalTemp; Hadley/UEA’s HadCRUT5; Berkeley Earth; and Copernicus/ECMWF.
The figure below shows my estimate of where 2024 temperatures will end up in each of the groups, based on the year to date and expected El Niño-Southern Oscillation (ENSO) conditions in the tropical Pacific for the remainder of the year.
The dots reflect the best estimate, while the whiskers show the two sigma (95%) confidence interval of the projections. The prior record year (2023 in all groups) is shown by the coloured square.
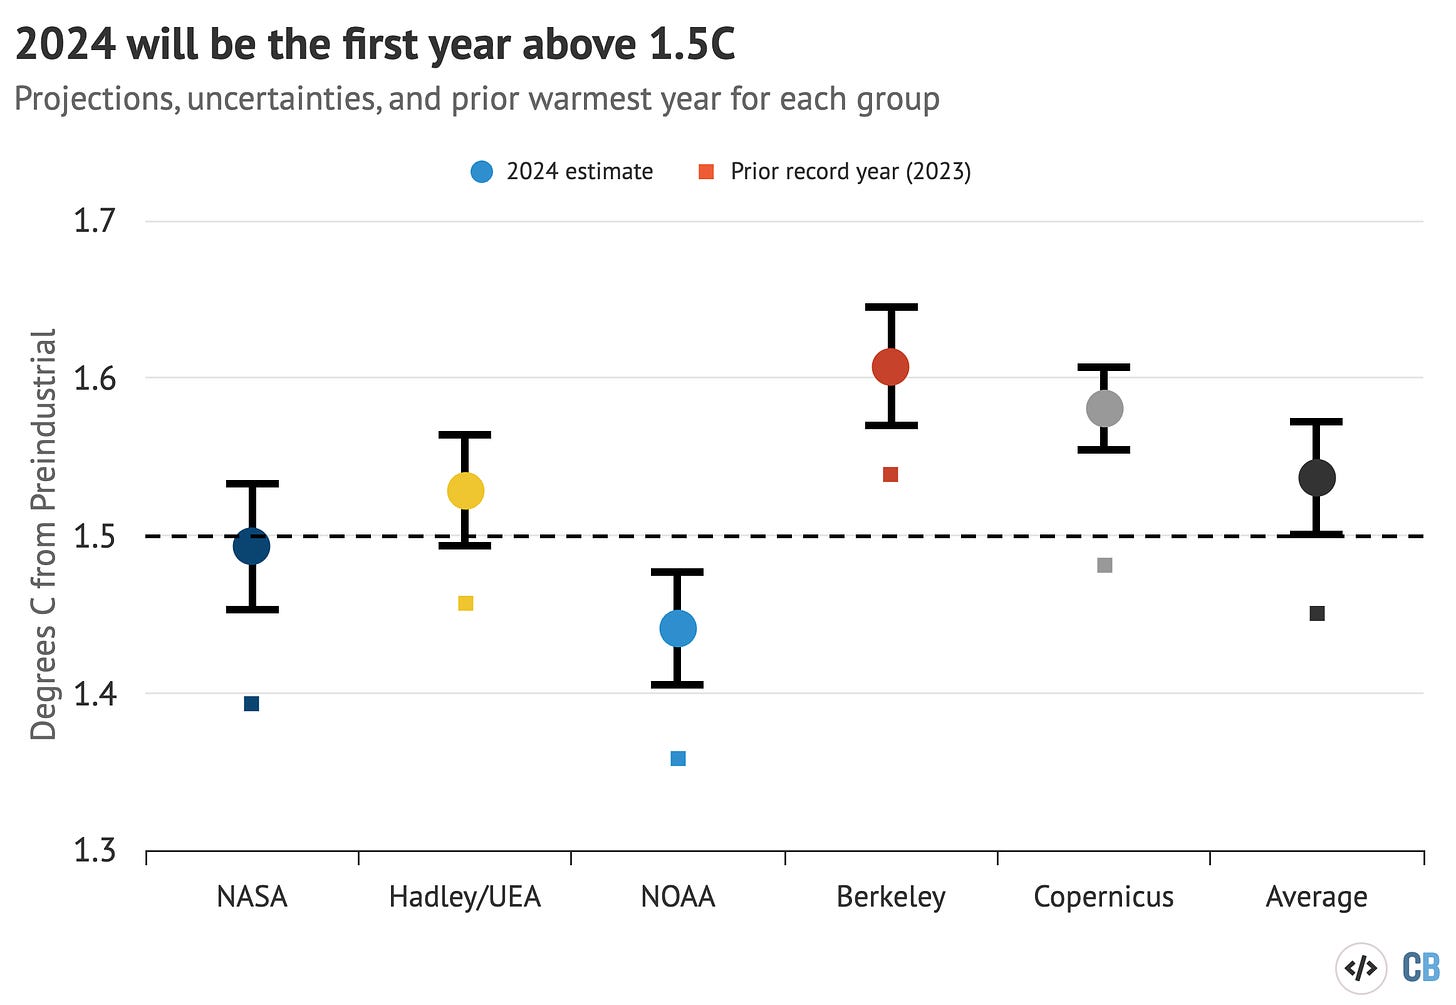
Carbon Brief’s project of 2024 annual global average surface temperatures for each group, along with 95% confidence intervals and prior record (2023) values. 1.5C above pre-industrial (1850-1900) levels is shown by a dashed line. The average projection represents a composite of all five records following theWMO approach. Chart by Carbon Brief.
In all cases, the projected global average temperature for 2024 is virtually certain to exceed the prior record set in 2023.
Three of the five groups (Hadley, Berkeley and Copernicus/ECMWF) are very likely to show annual temperatures exceeding 1.5C above pre-industrial levels (defined here as the 1850-1900 period), while the NASA record has a roughly 40% chance of exceeding 1.5C. Only NOAA’s record is unlikely to show global temperatures above 1.5C this year.
These differences in warming since pre-industrial across different datasets primarily result from choice of ocean records used, as well as differences in approaches to filling in gaps between observations in the early part of the records (e.g. pre-1900s). It reflects the uncertainty in the degree of warming since the mid-1800s, with projected 2024 temperatures ranging from 1.44C (NOAA) to 1.61C (Berkeley Earth).
The figure also provides a composite average of the five different datasets, following the approach used in the sixth assessment report (AR6) from the Intergovernmental Panel on Climate Change (IPCC) and by the WMO. My analysis finds that 2024 will be the first year above 1.5C in the composite average.
This provides a way to determine the first year where we can reasonably say that the world has passed that warming level – even though 2023 exceeded 1.5C in the Berkeley Earth dataset and 2024 will not exceed 1.5C in the NOAA dataset.
(It is important to note that exceeding 1.5C in a single year is not equivalent to breaching the Paris Agreement limit. The goal is generally considered to refer to long-term warming – typically over two or three decades – rather than annual temperatures that include the short-term influence of natural fluctuations in the climate, such as El Niño.)
The figure below shows the annual temperatures from each of these groups between 1970 and present, with the year-to-date 2024 temperatures for each record shown as individual points.
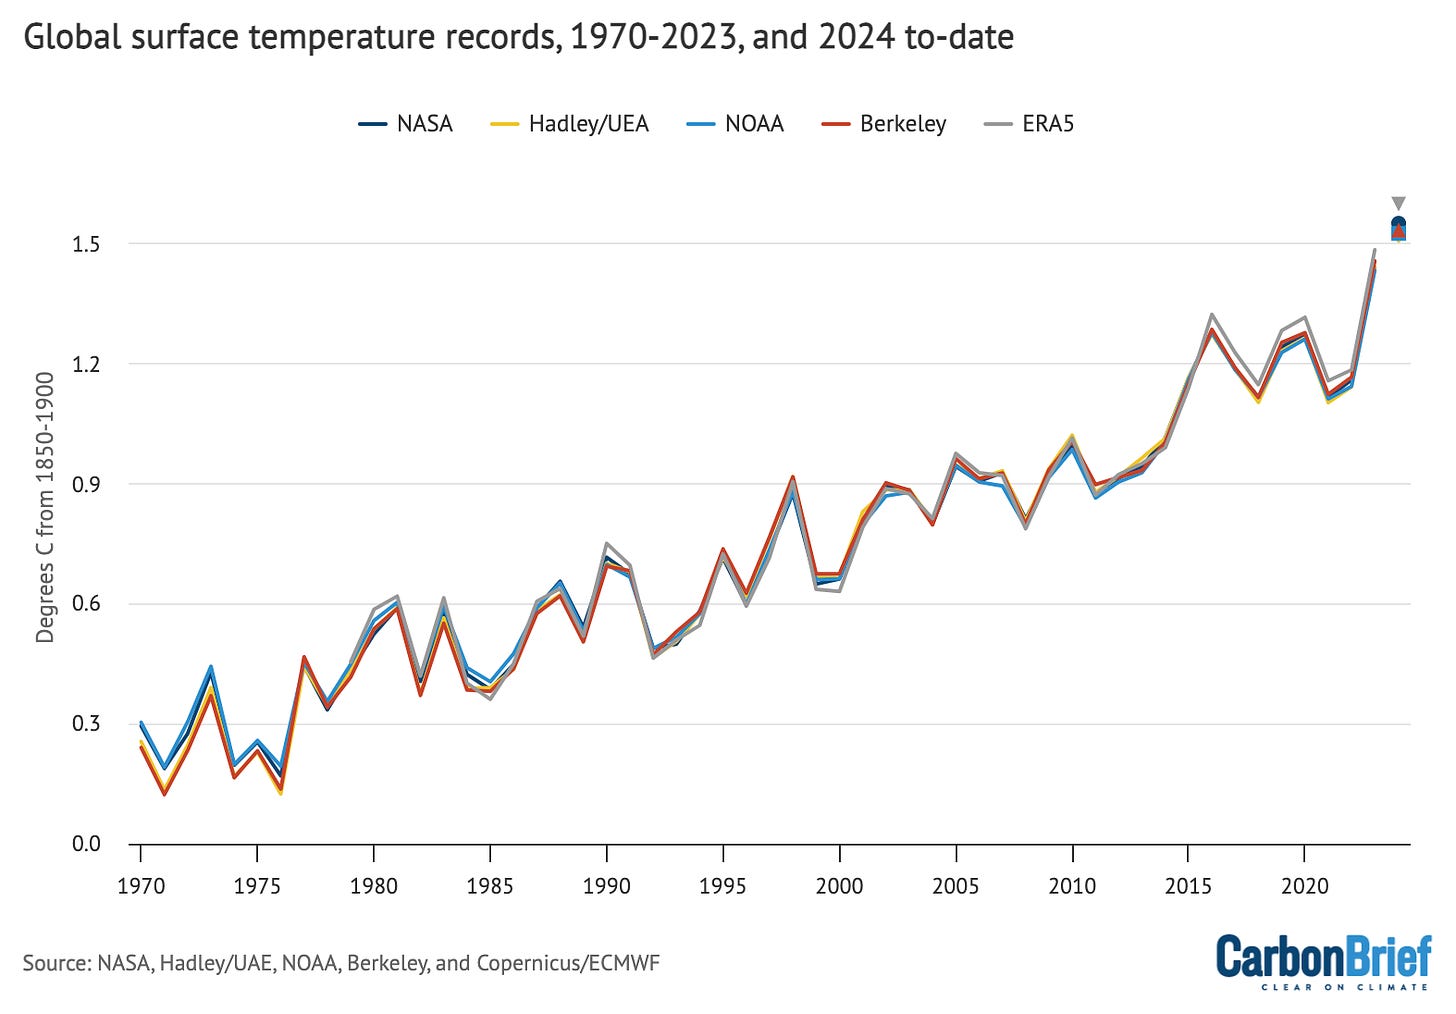
Annual global average surface temperatures from NASA GISTEMP, NOAA GlobalTemp, Hadley/UEA HadCRUT5, Berkeley Earth and Copernicus/ECMWF (lines), along with 2024 temperatures to date (January-September, coloured shapes). Each series is aligned by using a 1981-2010 baseline, with warming since pre-industrial based on the IPCC AR6 estimate of warming between pre-industrial and the 1981-2010 period. Chart by Carbon Brief.
There is strong agreement between the different temperature records, with all of them showing approximately 1C warming between 1970 and present. Global temperatures have been around 1.3 above pre-industrial levels in recent years (with a range of 1.2C to 1.4C across the different temperature datasets, reflecting that the differences between them are larger in the 1800s and early 1900s).
As the chart below shows, 2024 (purple line) started out remarkably warm as a result of a strong El Niño event that built in 2023 (red) and peaked near the beginning of the year.
However, global temperatures have remained quite elevated despite the fading of El Niño conditions, setting records through June and remaining quite close to 2023’s exceptional highs in recent months.
Overall, 2024 has set or tied all-time records for seven of the 10 months available to-date in the ERA5 record. (This record uses weather model-based reanalysis to combine lots of different data sources over time.)
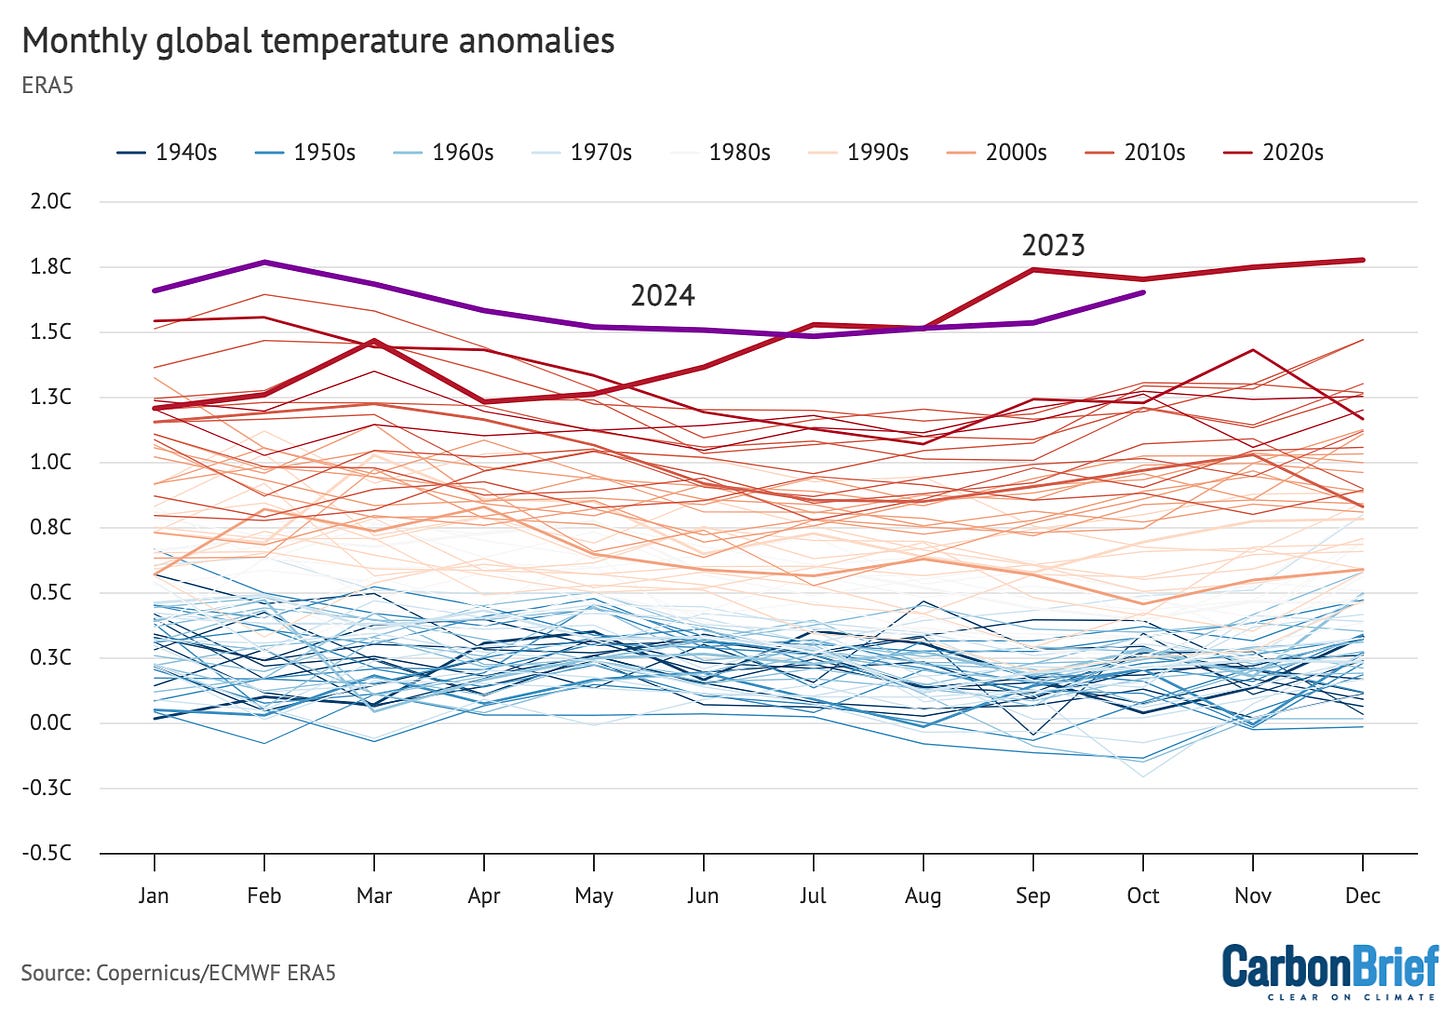
Temperatures for each month from 1940 to 2024 from Copernicus/ECMWF ERA5. Anomalies plotted with respect to a 1850-1900 baseline. Chart by Carbon Brief.
While human emissions of CO2 and other greenhouse gases are responsible for effectively all of the Earth’s long-term warming, temperatures in any given year are strongly influenced by short-term variations in the Earth’s climate that are typically associated with El Niño and La Niña events.
These fluctuations in temperature between the ocean and atmosphere in the tropical Pacific help make some individual years warmer and some cooler.
The figure below shows a range of different ENSO forecast models produced by different scientific groups. The values shown are sea surface temperature variations in the tropical Pacific – the El Niño 3.4 region – for three-month periods.
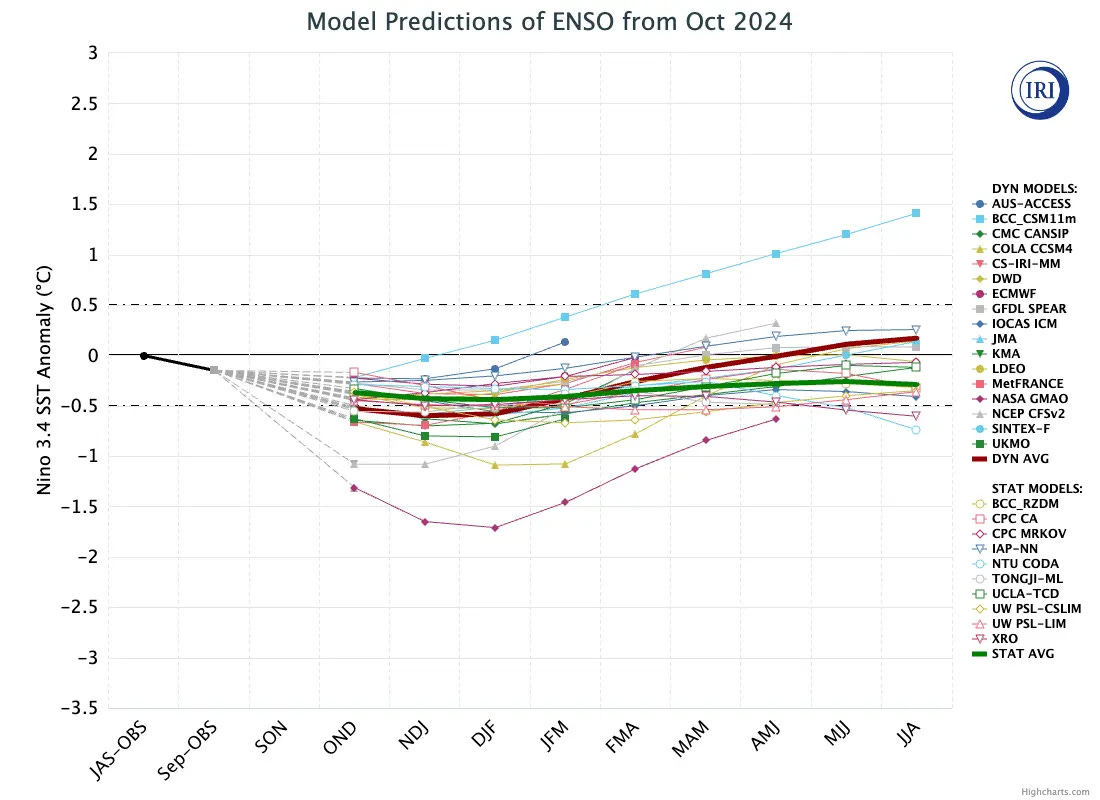
El Niño Southern Oscillation (ENSO) forecast models for overlapping three-month periods in the Niño3.4 region (July, August, September – JAS – and so on) for the remainder of 2024 and then into the spring and summer of 2025. Credit: CPC/IRI ENSO forecast.
Most models expect neutral conditions in the tropical Pacific, with only a few crossing the -0.5C Niño 3.4 sea surface temperature (SST) anomaly that represents the development of a formal La Niña event.
This should result in relatively cooler temperatures in 2025, though it is possible that the year ends up warmer than anticipated given the continuation of high temperatures in recent months – despite the absence of El Niño conditions.
While global average temperatures are an important indicator of changes to the broader climate system over time as a result of human activities, these impacts will differ as some regions experience more rapid warming or extreme heat events than is reflected in the global average.
The figure below shows the parts of the world that saw record warm or cold temperatures over the first three quarters of 2024 (January through to September) in the Berkeley Earth dataset compared to all prior years since global temperature record began in 1850.
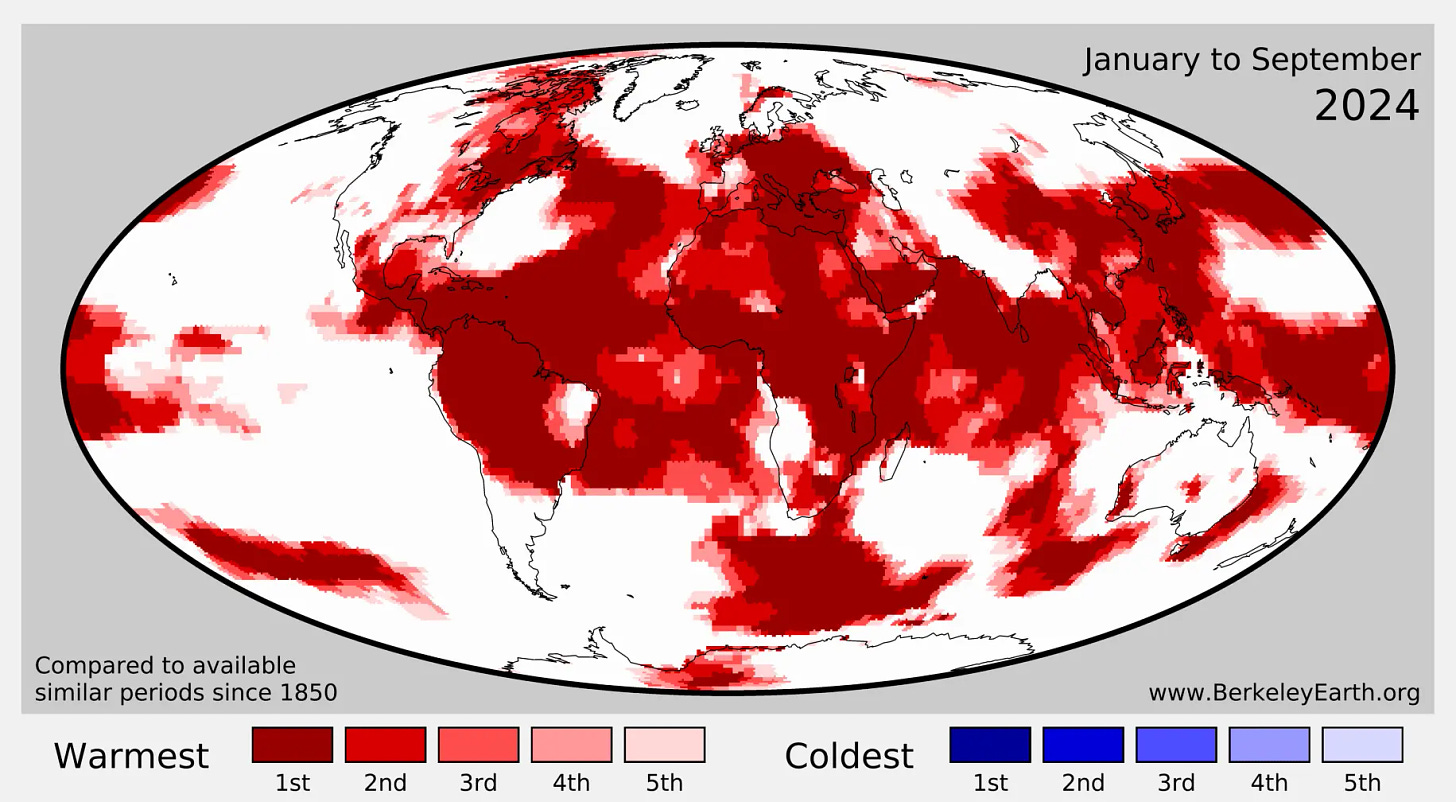
Map of year-to-date (January-September) regions that set new records (warmest through to fifth warmest). Note that no regions set cold records for the year-to-date in 2024. Credit: Berkeley Earth
Notably, no area on Earth saw record cold (or even the second, third, fourth or fifth coldest temperatures on record). Nearly all of Central America and large parts of South America saw their warmest year to date on record, as did much of eastern Europe, Africa, China, south-east Asia, and Korea.
The figure below shows the temperature anomaly over the first nine months of the year compared to the 1951-80 baseline period used by Berkeley Earth. Warming was particularly pronounced over land regions, with many areas already showing warming of 1.5C or 2C above that baseline.
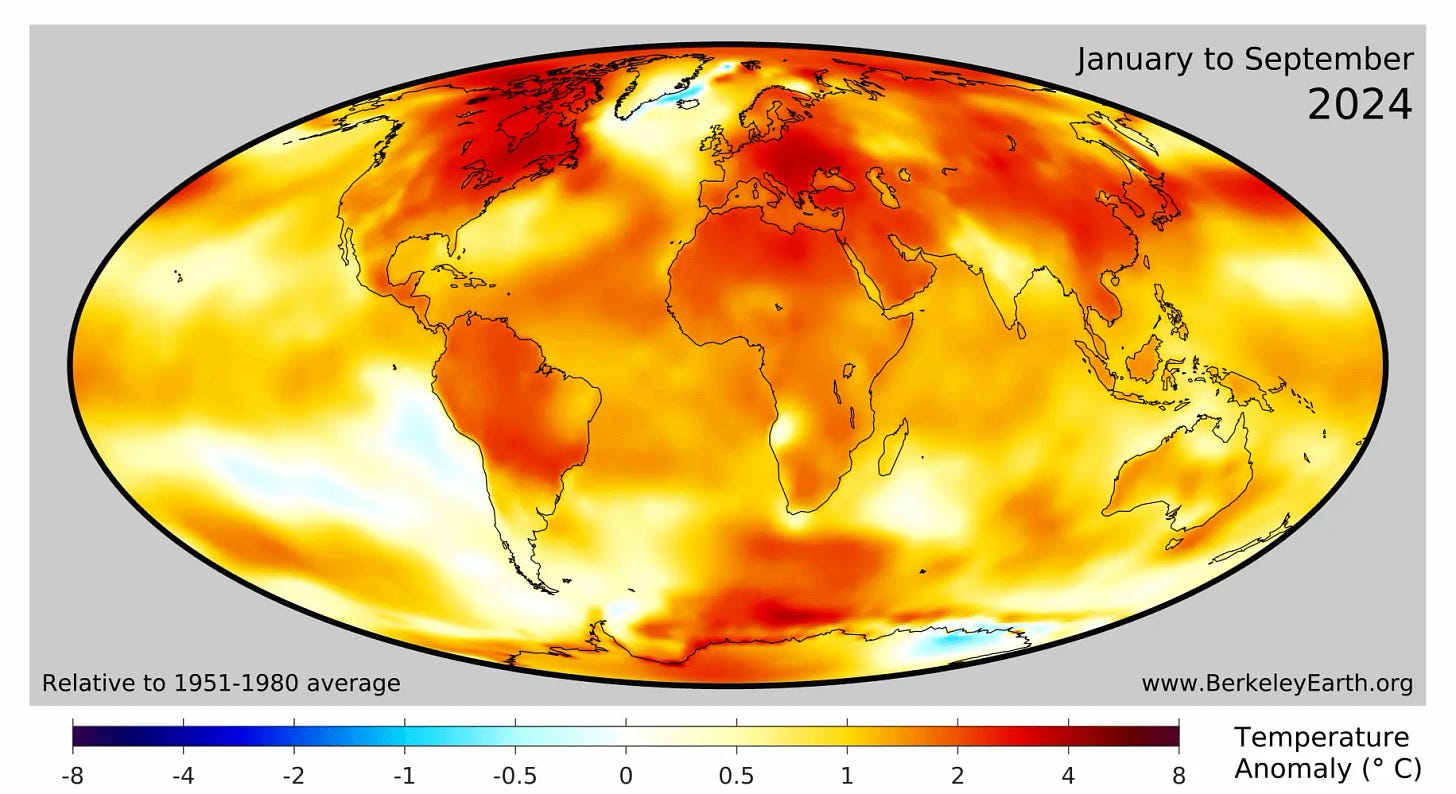
Map of year-to-date (January-September) global surface temperatures. Anomalies are shown relative to the 1951-80 period following the convention used by Berkeley Earth. Credit: Berkeley Earth


